

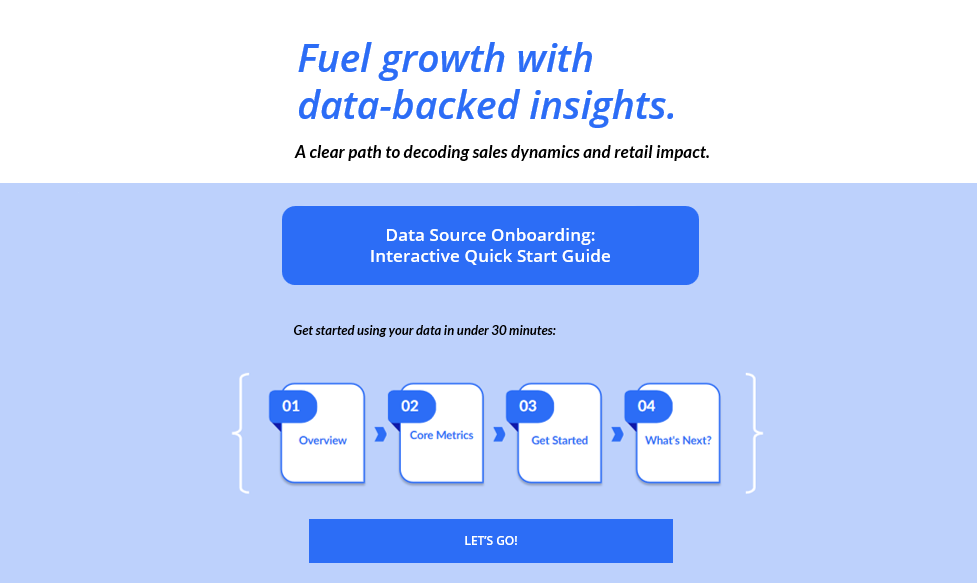
Data Source Onboarding: Quick Start for New Users
Get up to speed quickly on the essential data knowledge needed to build a basic report.
Click below to see the script for the Build a Report how-to video:
Audience
Customers new to the data source and reporting platform
Tools Used
Articulate Rise, ScreenPal, Contentful, Microsoft Word, PowerPoint, Asana
Note: Original materials cannot be shared due to company confidentiality. Visuals included are masked.
The Challenge
New users struggled to understand core measurement concepts and apply them effectively within the reporting platform. Existing documentation was dense, fragmented, and difficult to navigate, making onboarding slow and overwhelming. Learners lacked confidence in interpreting foundational metrics and had no streamlined entry‑level learning path to bridge the gap between technical documentation and more advanced analytics training.
The Solution
I scoped and delivered a Quick Start Learning Program designed to give new users immediate confidence with the reporting platform. The program introduced essential concepts, emphasized the most critical metrics, and guided learners through building a basic report using clear, step‑by‑step instruction. By combining interactive eLearning, a concise video tutorial, and supporting job aids, the experience offered multiple reinforcement points and served as the first stage in a larger learning journey. Early adoption feedback confirmed ability to build a basic report in under 30 minutes.
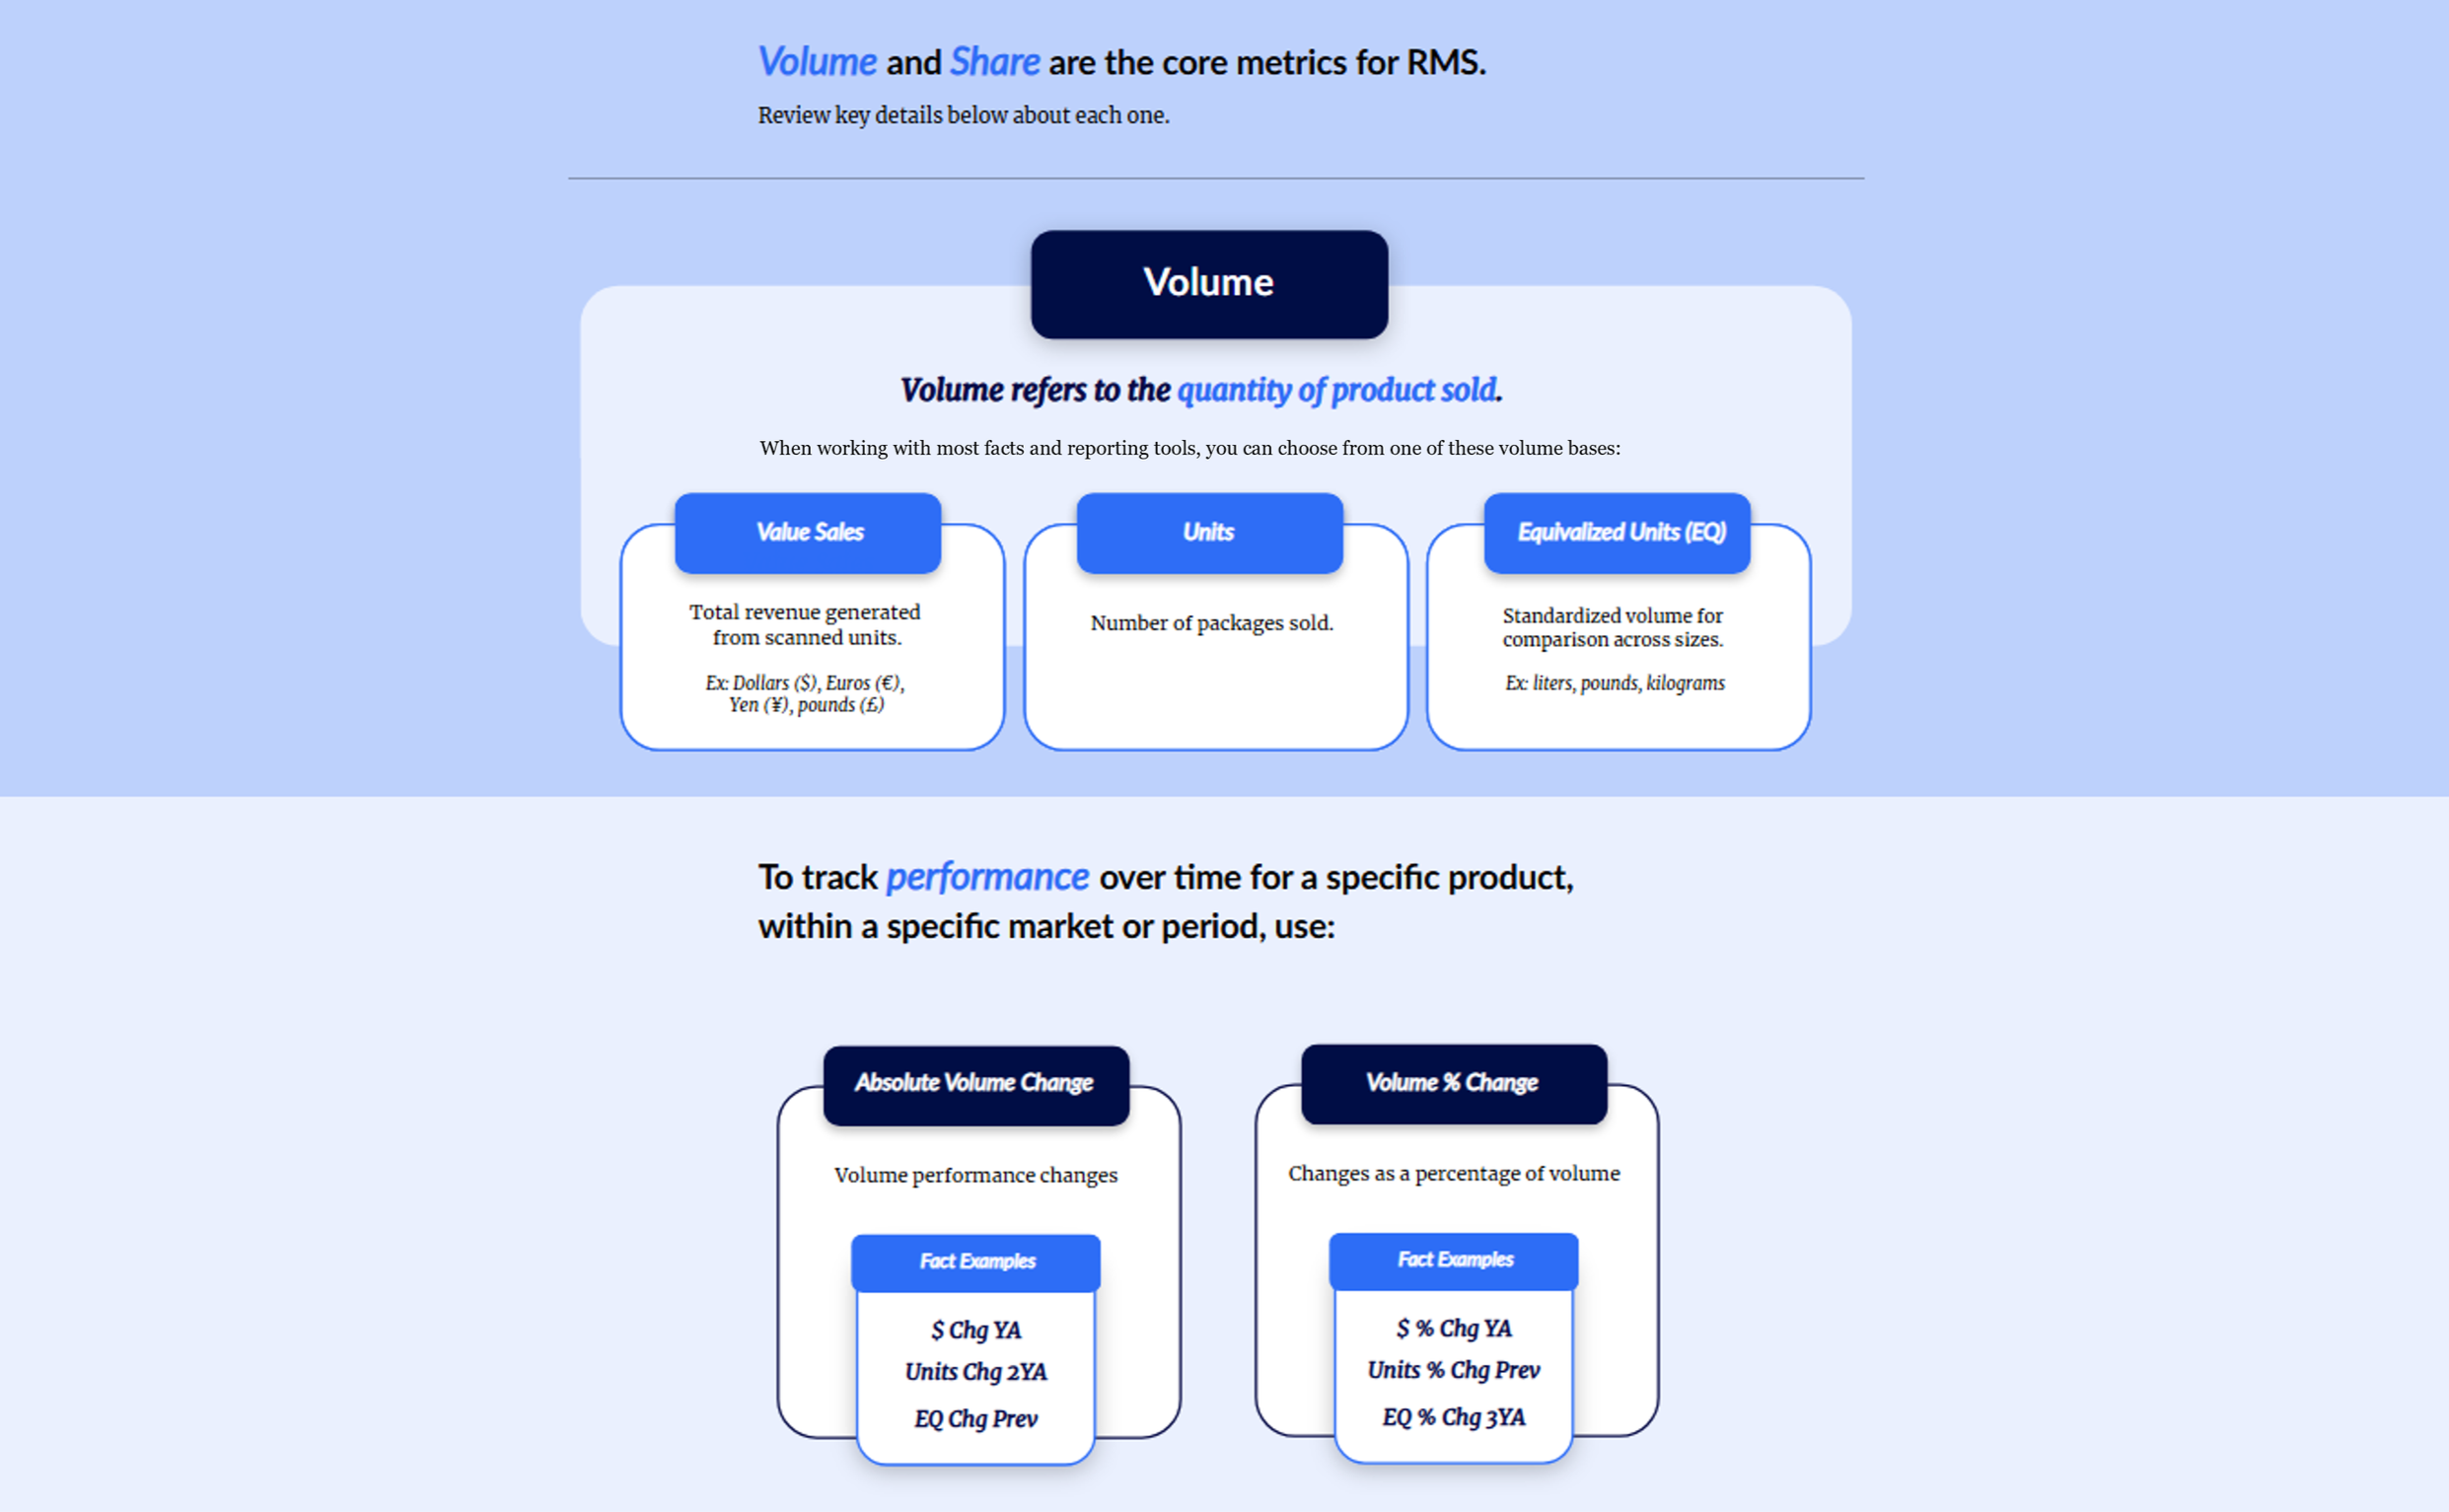
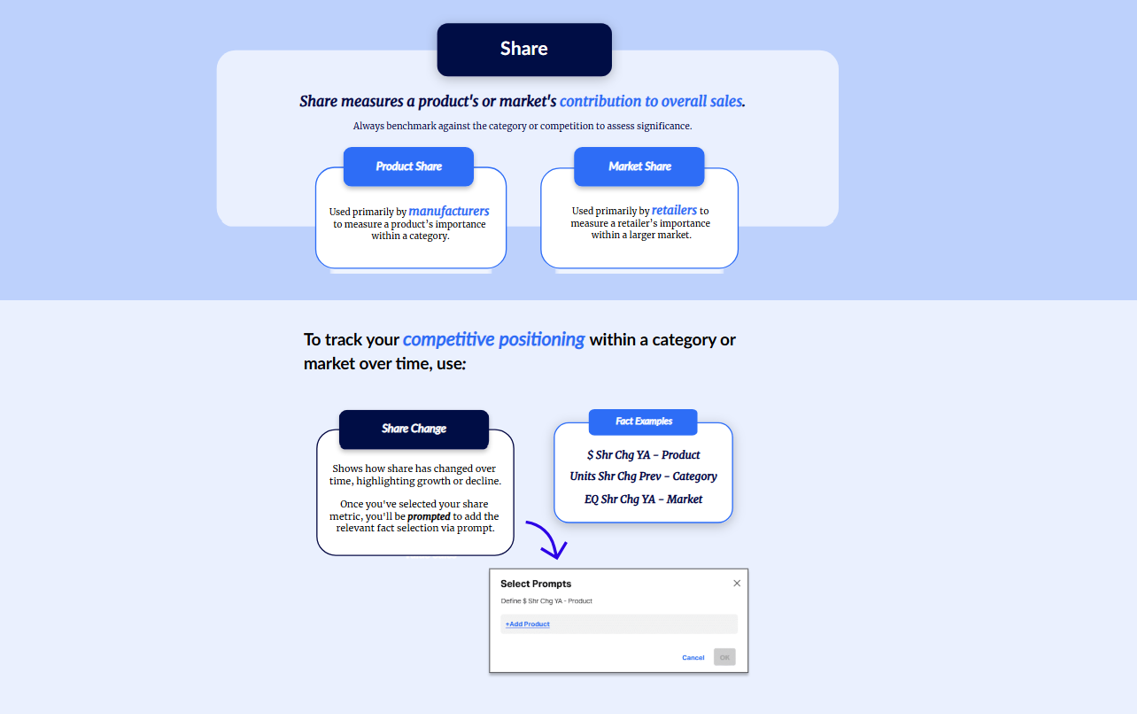
Core Metrics Visuals (Rise)
My Process
Instructional Theory in Practice
This project was grounded in:
Bloom’s Taxonomy — to define clear, foundational learning objectives.
Gagné’s Nine Events of Instruction — to structure the learning flow and support engagement.
Adult Learning Principles — to ensure relevance, clarity, and immediate application.
These models guided decisions across each ADDIE phase to ensure the program was accessible, confidence‑building, and aligned with real‑world reporting tasks.
-
I drew on several years of experience designing and maintaining training for this data source, giving me deep insight into user pain points and real reporting workflows. I reviewed stakeholder insights and existing materials to identify redundancies and gaps, then collaborated with SMEs to clarify business use cases and reporting requirements — ensuring the program was grounded in what new users actually struggle with, not just what the documentation covers.
Gagné Integration: Stimulated recall by connecting new content to familiar reporting challenges and prior resources.
-
Learning objectives were defined against Bloom's Taxonomy (Remember → Understand → Apply) and mapped to the specific tasks new users need to complete in the platform. I structured the program into four modular segments — Overview, Core Metrics, Get Started, What's Next — sequenced to progressively build confidence before asking learners to apply skills independently.
Gagné Integration:
Informed learners of objectives.
Gained attention through bold visuals and real‑world scenarios.
Provided learning guidance with embedded tips and walkthroughs.
-
I built the Quick Start module in Articulate Rise with layered interactivity and scenario-based examples, produced a step-by-step how-to video in ScreenPal, and created supporting job aids and reference articles translated into Contentful Markdown for LMS publishing. Knowledge checks with immediate feedback were integrated throughout to reinforce each stage of learning.
Gagné Integration:
Presented content through concise visuals and examples.
Elicited performance through guided practice.
Provided feedback via knowledge checks.
-
I created SCORM packages for the Rise module and published them to the LMS, while coordinating with the developer on simultaneous Contentful publication of reference articles and job aids. Managed timelines and stakeholder communication to ensure the eLearning module and all supporting resources launched together as a cohesive experience.
Gagné Integration: Enhanced retention and transfer by ensuring ongoing access to job aids and reference articles.
-
Formative evaluation was built in through knowledge checks and self-assessment prompts throughout the module, with early initial customer feedback confirming the program’s success in enabling users to build a basic report in under 30 minutes. Post-launch, engagement metrics, completion rates, and learner confidence data are continually monitored to identify strengths and opportunities for iteration. As additional data is collected, findings will inform future scenario expansion and content updates.
Gagné Integration: Assessed performance through knowledge checks and self‑assessment prompts.
Reflection: Project Takeaways
Key Learnings
This project reinforced the value of designing clear, foundational learning experiences that reduce cognitive load and build early confidence. The modular structure, layered interactivity, and guided practice helped learners bridge the gap between dense documentation and real‑world reporting tasks. The digital‑first approach also proved highly scalable, supporting consistent onboarding across customer teams.
Enhancement Opportunity
Incorporate a wider range of scenarios to reflect diverse customer contexts.
The initial Quick Start focused on a single, representative reporting example. Future iterations could include optional scenario variations tailored to different industries or use cases, helping learners see themselves more directly in the content and increasing transferability.